Money Moves Markets
Equity rotation consistent with liquidity squeeze
January 17, 2022
The violent rotation in equity markets since the start of the year appears to have been driven by a tightening of liquidity conditions hitting high-flying growth stocks, rather than signalling increased economic optimism and a resumption of the late 2020 / early 2021 “reflation trade”.
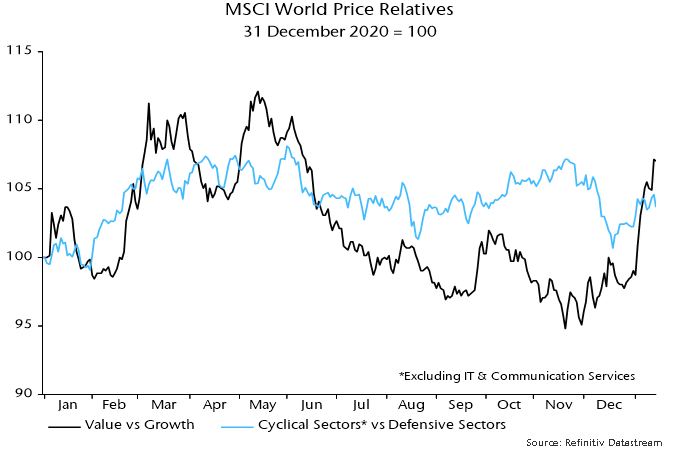
The price relative of MSCI World value to growth surged 8.1% between 31 December and last week’s close, reaching its highest level since June. The relative of non-tech cyclical sectors to defensive sectors was up by “only” 1.4% over this period and remains below a November secondary peak – see chart 1.
Chart 1
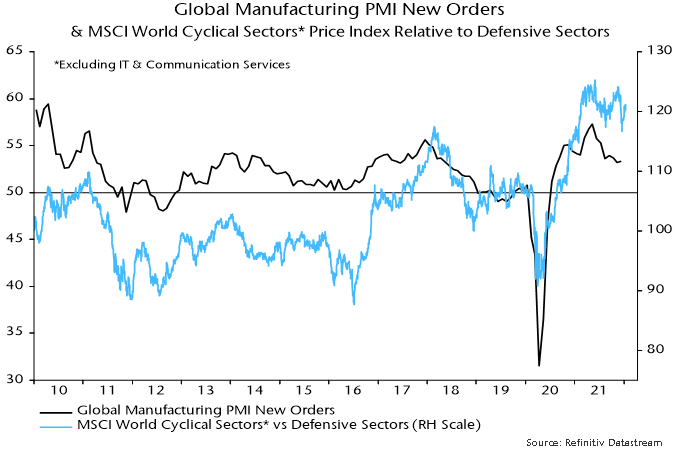
The behaviour of the cyclical to defensive sectors relative remains consistent with the view here that the global manufacturing PMI new orders index is in a downtrend – chart 2. This relative has displayed a much stronger correlation with the PMI historically than value vs. growth.
Chart 2
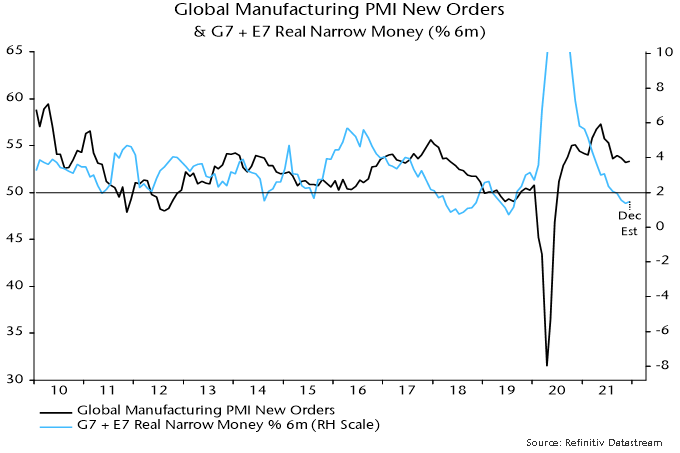
Global six-month real narrow money growth leads the PMI and is estimated to have moved sideways in December after November’s 27-month low. The suggestion is that the PMI will fall further in H1 with no recovery before Q3 at the earliest – chart 3.
Chart 3
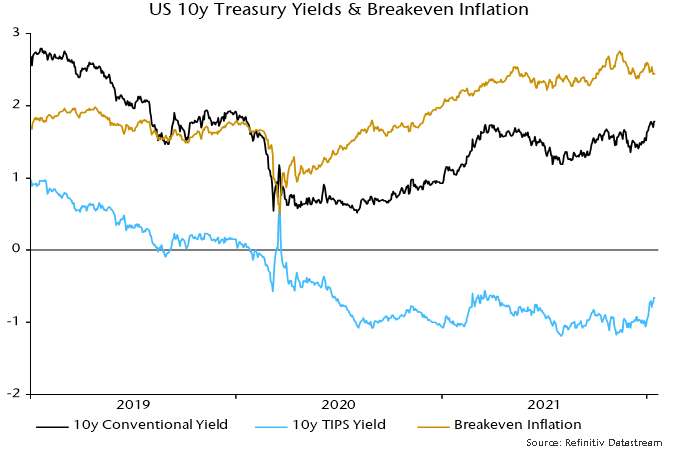
The view that equity market moves reflect liquidity tightening rather than reflation optimism is supported by the stability of Treasury market breakevens and a rising real yield – chart 4.
Chart 4
As previously discussed, both measures of global “excess” money tracked here are now negative for the first time since 2019.
On this view, the Fed’s “hawkish pivot” has been coincident with rather than the key driver of tighter liquidity.
Growth stocks may continue to suffer near term but the forecast of a global economic slowdown suggests approaching liquidity relief. The rally in the cyclical vs. defensive sectors relative, meanwhile, may reverse as activity news disappoints.